In the previous post we learned The DevOps Practices of the Flow that help us to deliver faster and safer. Whenever you feel that your releases are suffering from poor quality, requiring too much manual/grunt work, bureaucratic approvals and such, visit the principles of the flow post and get it all together to achieve fast flow from Dev to Ops. In this third part of our Devops Journey series, I’m going to present to you the practices that will give you the ability to quickly identify and fix problems that happen after the software has been deployed.
As software developers, we tend to be too focused on delivering, launching features, and putting things to work for customers. This is why we often don’t think about what happens right after: how will I be able to know what happened when a customer reports an issue? How can I know that everything is working just fine in the production environment all the time? These days even the simplest software projects probably contain a lot of complexity involved. A fact of life is that our system is going to produce unexpected outcomes sometime, so the point here is not to avoid these outcomes at all cost, but to be ready to respond to these incidents by being aware of how and when things went wrong. As a concerned developer, you surely want to be aware of a system outage before your customers, and this is exactly what this post is about.
Let’s check then the main practices you should keep an eye on to recover faster from unpredicted disasters and quickly fix problems as they occur.
Create centralized telemetry
We often find ourselves in a situation where we are not able to determine if a given issue is due to a problem in our application code, in our environment (e.g. network) or if it is something external to our software (e.g. third-party integrations). To avoid these situations, we need to design our systems so that they are always creating telemetry. Telemetry can be defined as “a collection of measurements or other data at remote points and their automatic transmission for monitoring.”.
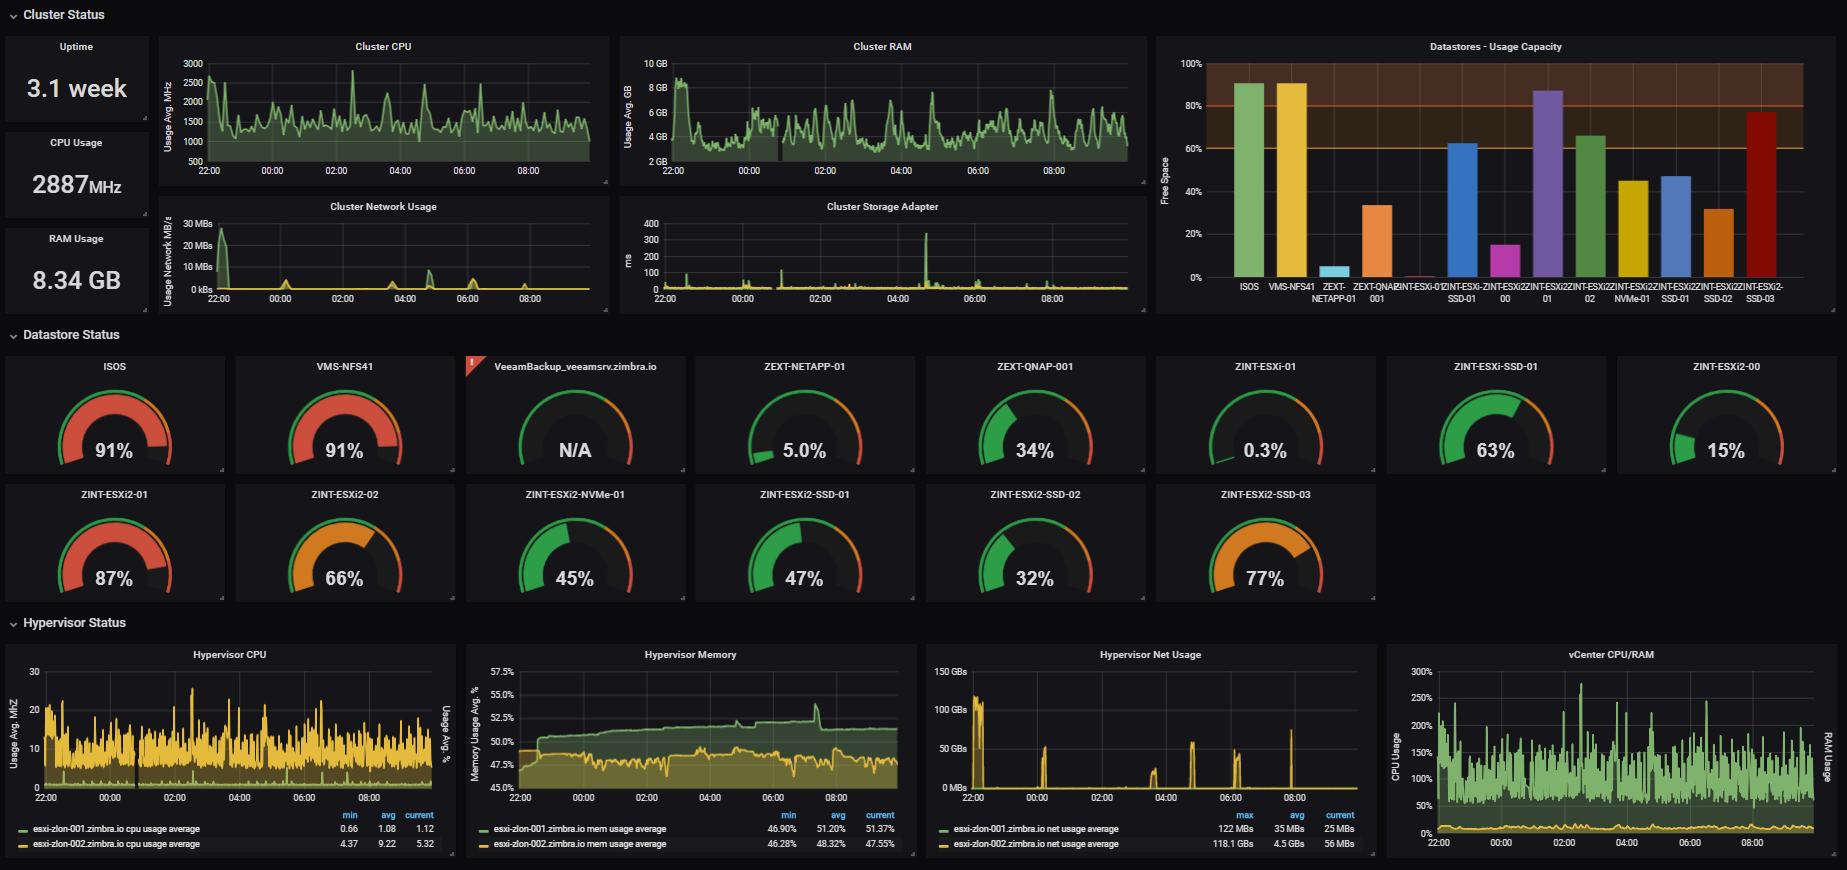
Image source: Building an IoT dashboard with NASA Open MCT
Our goal is to build telemetry into our application, so we can understand what is going on with our application at any time by collecting metrics: storage capacity, networking, security, database, CPU and so on. But of course, we also need to collect important telemetry information not only useful for developers, but also for operation’s people that needs to be able to understand what is happening on the system. To achieve this, the first step is to understand how a modern monitoring architecture looks like. In “The Art of Monitoring”, James Turnbull describes the components that compose a common monitoring architecture:
-
Data collection layer: this is where we are effectively creating telemetry in the form of events, metrics, and logs. We want these data collected to be sent to a common service that enables easy centralization so we can easily manage, query, and visualize it. At this layer, we collect metrics from the entire application stack, and we can do it using a mix of different tools. such as Log4j for Java, Splunk, Sentry, and so forth. As always, the tool you choose will depend on specifics of your scenario. The most important thing here is to be sure you are collecting at this layer important and meaningful information that will help you later.
-
Event router: by collecting, storing, and aggregating our telemetry data, here we will enable further analysis and health checks this capability enables visualization, alerting, and anomaly detections.
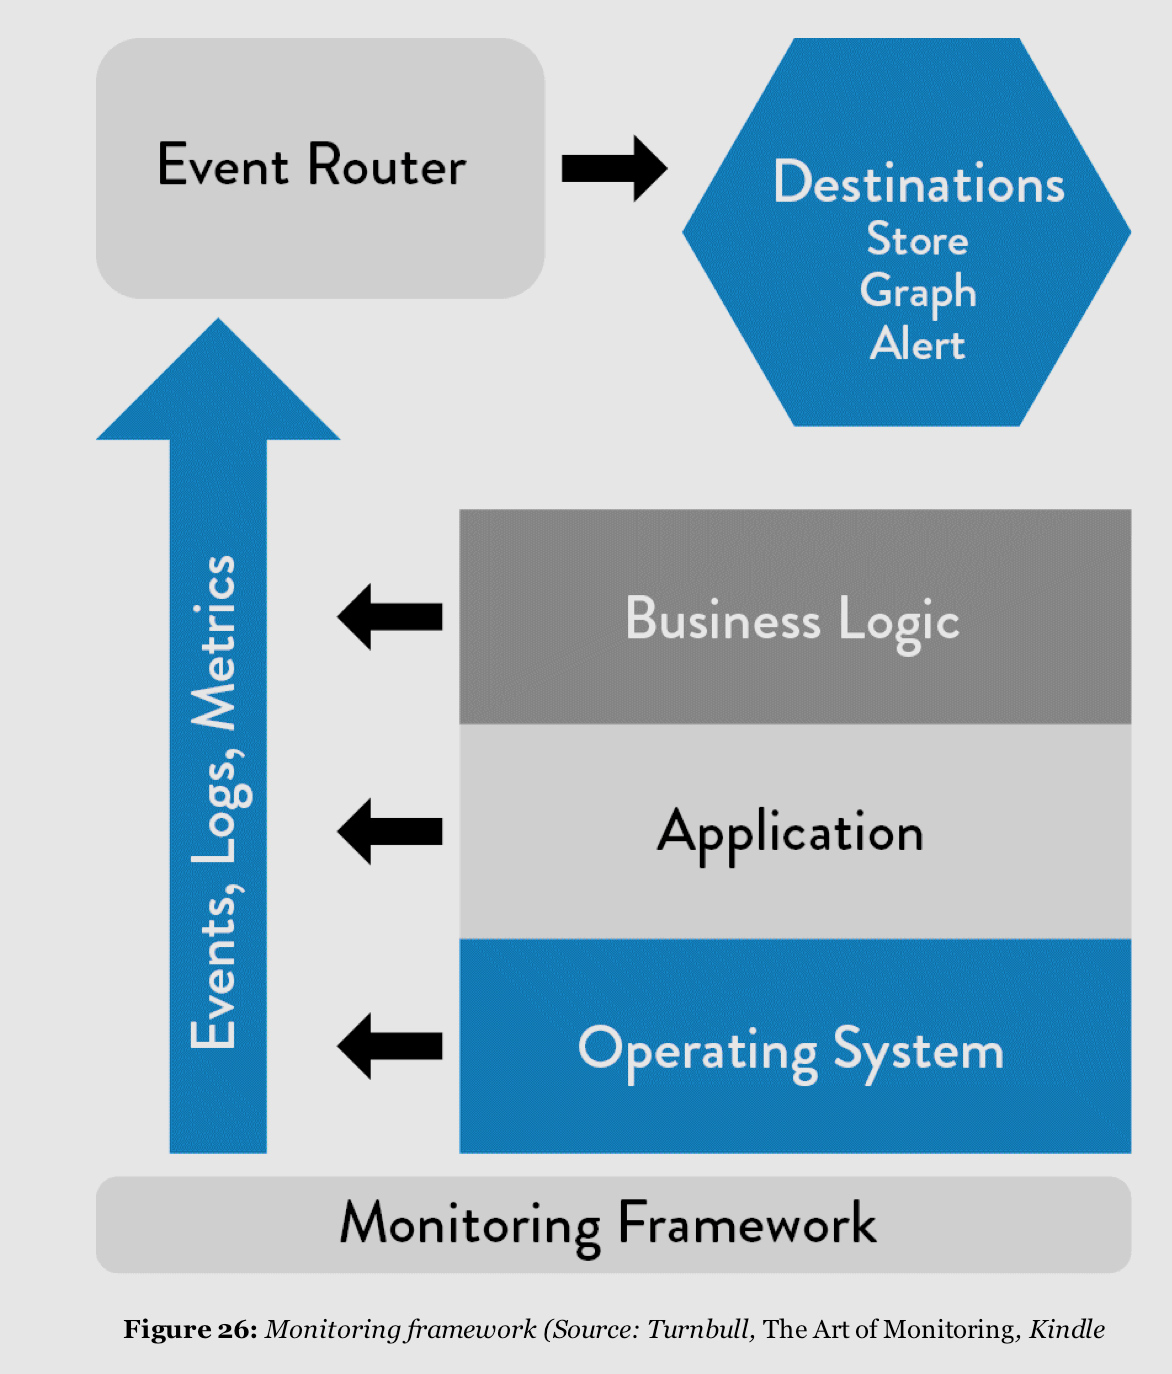
Image source: DevOps Handbook Summary 2 of 4 - The Second Way
Once we have our logs centralized in a single place, we can transform them into metrics. A log event such as “User with ID: 123 failed to log in - 500” can be counted and summarized in a way that enables us to understand that, depending on the amount and the frequency of this event, we have a problem with our authentication feature. This is especially useful to anticipate issues by creating alarms: if we have more than 20 events like this in a 5 minutes period, send an email to someone to investigate what is going on.
We must make sure that is easy to enter into our telemetry dashboard to retrieve information. Everything here should be readable, preferable trough comprehensible UIs and/or self-service APIs, accessible by everyone on the team to avoid bureaucratic approvals and tickets that always leads to waiting for getting reports. This monitoring system must be available and should be treated as a critical component of our project. Just like you don’t want your shopping cart feature to fail and your system to go down in a moment of heavy usage, you won’t want your monitoring system to be out. Remember this!
Holding this in mind, you may search around for tools that provide you this exactly monitoring architecture, such as AWS cloud watch, ELK (Elastic Search, Logstash and Kibana), Splunk, Sentry, New Relic, Grafana and Prometheus. Some of these are OSS, some are proprietary and pretty expensive (hello New Relic). Make sure you understood how does your chosen tool charge you, some of them will charge per storage, per queries, per alarms, and so on, therefore this is a really important phase where you should choose wisely.
Include telemetry as part of daily work
After creating our telemetry dashboard and we have the monitoring stuff up and running, now we want to make sure every new software that is created within our organization comes with integrated telemetry. Create metrics must be considered part of your definition of done whenever you create new services and features. To make it easier we can count on some tools that allow our system to continuously send telemetry data into our centralized dashboard: statsD was created by Etsy to prevent any developer from saying that it’s too much of a hassle to collect metrics from their code. It can generate counters and timers with one line of code and it is often used in conjunction with some visualization tool such as Grafana, that renders the collected data into graphs.
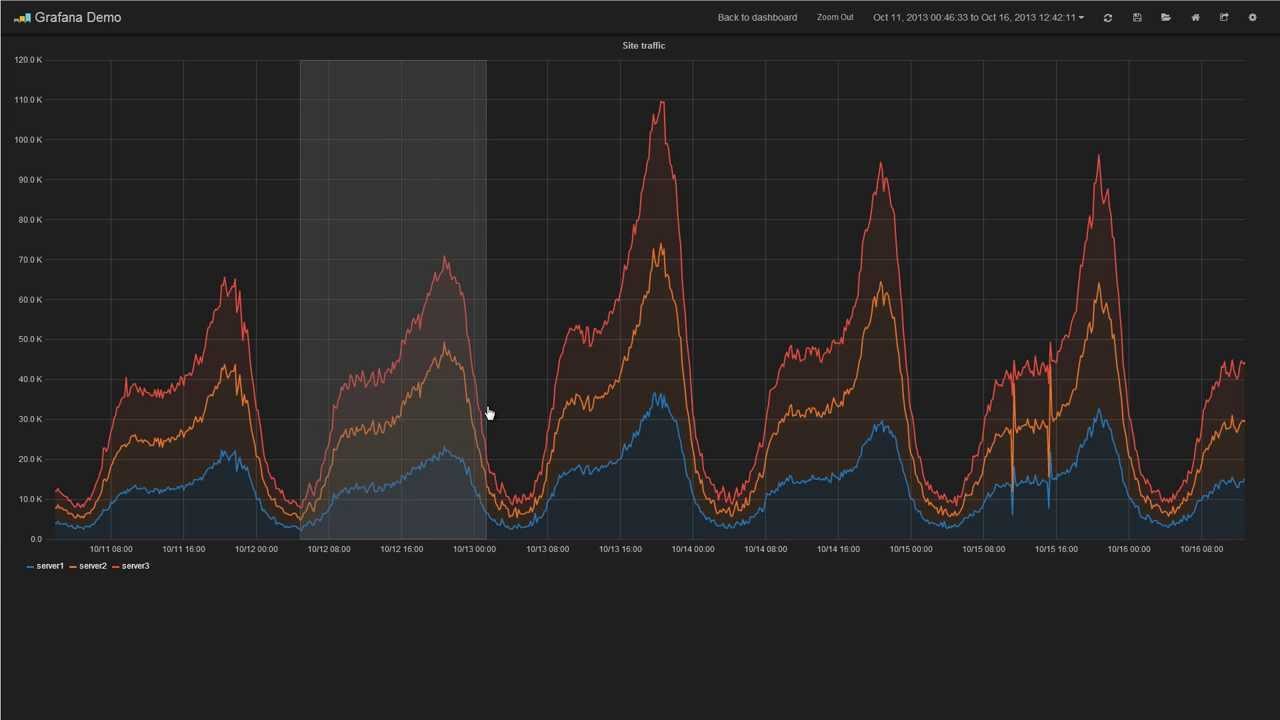
Image source: Grafana - The Graphite Dashboard, Demo on YouTube
Remember to strive for the easiness of integrating telemetry into your software, so this is going to be a natural part of your everyday work.
Fill telemetry gaps
Having our centralized telemetry infrastructure, we must ensure that we are creating sufficient telemetry to fulfill everyone’s needs. Developers, Operation’s people, Security engineers, they all should be able to use the monitoring system to get insightful information according to its given context of work in a variety of ways. To support these different use cases, we can rely on different log levels. Most of the logging libs out there provides the following levels:
-
DEBUG: This level is related to anything that happens in the system, often used during debugging. This is commonly enabled at the development environment, and can also be temporarily enabled in the production environment for specific troubleshooting activities.
-
INFO: Used mostly to mark beginnings and endings of flows, for example: “Payment 123 process start”.
-
WARN: Used to identify events that may cause errors. Any event that does not happen in ideal situations and can potentially cause errors. As a good example, we can think of an event like “the query
-
ERROR: Represents errors that occur during the execution: “API call failed, database insert operation failed”.
-
FATAL: Information at this level represents events that will require us to terminate the execution.
Choosing the correct logging level for each context of your application is very important. If well defined, it can save you time and provide great insights that will help you to anticipate failures. But when poorly defined, a simple log event alert may wake you up at 2 a.m. because a CPU is working at 60% of its capacity.
As some of the most commonly relevant information that should be tracked by your telemetry on different logging levels I would highlight:
-
Data changes, such as adding, updating, or removing existing resources.
-
Authentication decisions (logoff and sign-in timestamps).
-
Computational resources consumption (CPU, RAM, disk, and others depending on your infrastructure).
-
Delays on operations such as API calls and database access.
-
Startups and shutdowns of the services.
The information that might or might not be relevant, of course, depends on your context. It’s important that everyone is involved in the processes of defining which metrics matter. Having exclusively developers defining which metrics should be added into the monitoring systems can lead to a situation where other departments are not able to extract useful information from it. Application business metrics are also a matter of our monitoring system, it should provide information to anyone interested in this aspect as well, so beware dear developer, and make sure you are creating useful stuff.
Create instrumentation and alerts to predict catastrophes
Having the monitoring system continually collecting data from our application, we need to make the best use of it. The data should not only be available to anyone interested, but if well organized among the possible logging levels, it can advise us when things are going wrong. By using anomaly detection techniques we can configure our telemetry system to take actions when a given metric deviates too much from its expected values. As an example, think again in a simple authentication feature: you are not expected to see at the monitoring dashboard too many failing attempts in a short period of time. You can configure your telemetry system to send your team an email when the amount of “Authentication failed” logs appear in a frequency 3x bigger than the last week for instance.
It’s also possible and useful to use the telemetry data analysis to take automatic actions that affect directly out system functioning. Netflix has been great using this technique to perform predictive auto-scaling actions.
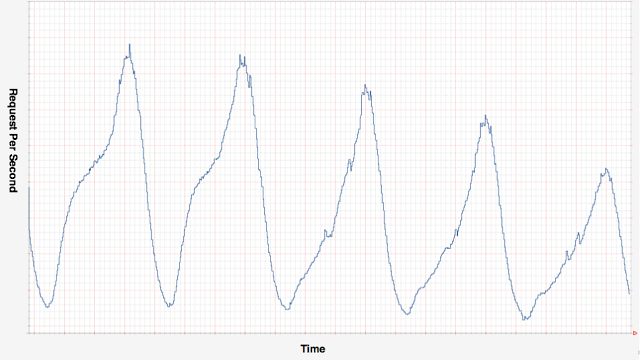
Image source: Scryer: Netflix’s Predictive Auto Scaling Engine, by Daniel Jacobson, Danny Yuan, and Neeraj Joshi
Netflix’s monitoring system watches for the spikes on the requests per minute metrics, and launch new instances to support their traffic as it needs. It also reduces the provided computing capacity when the RPM starts to decrease, to save money. Many monitoring tools already provide this alarming functionality out of the box. AWS’ Cloudwatch for instance has a great UI that allows you to easily configure actions you want your application to take in response to events or metrics changes. Depending on the kind of application you’re dealing with, this is another important point you should take into consideration when choosing the logging tools you are running.
It’s very important that we never stop striving for the DevOps state of art. Remember that to be able to deliver fast, constantly and safely is just half the way, we must also build telemetry, and constantly improve it to be capable of understanding what happens with our system whenever it changes. Allow everyone in the organization to see the status of the application, read the monitoring reports and dashboards, and always re-visit the metrics to make sure your telemetry data is enough to provide useful information to everyone.
When focusing on this second principle of Constant Feedback, the tools you choose to do the job is especially important, since they may define if it’s possible or not to achieve some of the goals we have discusses in this post, such as anticipating problems by creating alerts, filling the telemetry gaps by defining different logging levels among the features and so on. Therefore, spend some time researching the tools you are adopting here, and make sure they fulfill most of these requirements.
I hope that this post helped you to have a better idea on things you should focus on to be able to efficiently respond to incidents and collect feedback from your system. Subscribe to the newsletter to be notified when new posts come here and also to get some exclusive content related to DevOps.
If you liked this post, consider sharing it.